
Viewing Variable
Sat, 11/15/2008 - 21:08 — admin
Zaitun Time Series provides three ways to view a variable, spreadsheet view, graphic view, and statistics view. Viewing a variable is very simple. Double click the variable you wish to view. Zaitun Time Series will switch the main pane to the Variable View and view the selected variable.
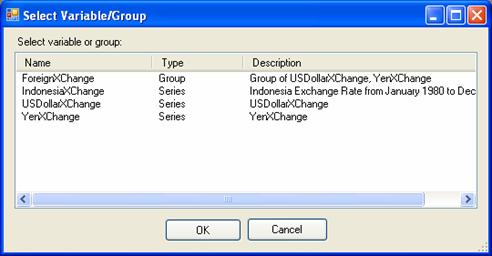
You can also view a variable by manually switching the main pane to the Variable View Pane and clicking Add Pane button on the top left side of the Variable Pane. Select Variable dialog appears. Select the variable you want to view and then click OK. Zaitun Time Series will add a new pane on the Variable Pane to view the variable.
The default view is the spreadsheet view. To change the current view of a variable click on the Variable View Combo Box on the top of the Variable View pane. You can switch to graphic view or statistics view.
Spreadsheet View shows variable values on a grid, it makes it easy for you to input or edit variable values by pressing numeric keys directly from keyboard. You can also paste values from an external program like Excel by right clicking the grid and selecting Paste menu.
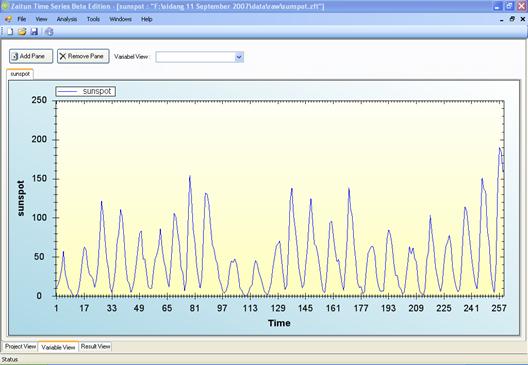
Graphic View shows variable values on a line chart. It makes it easy for you to analyze graphically the components of time series data of a variable. You will soon know whether the variable contains trend, cyclic, seasonal and irregular component.
Statistics View shows simple descriptive statistics of a variable making it easy for you to analyze statistical properties of a variable.
- Login to post comments