
Neural Network Modeling Result
Thu, 11/20/2008 - 21:31 — admin
The result views of neural network modeling in Zaitun Time Series are grouped into two categories, tables and graphics. The details of them are described here:
- Tables
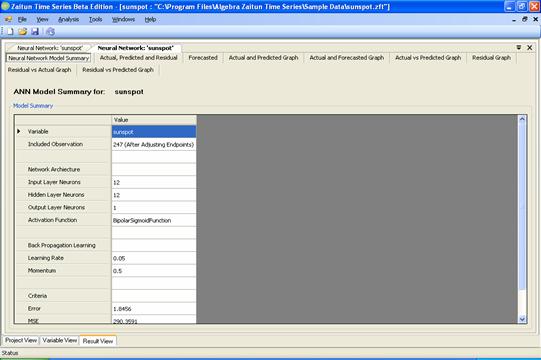
- Model Summary
Shows the summary of the neural network model - Decomposition Table
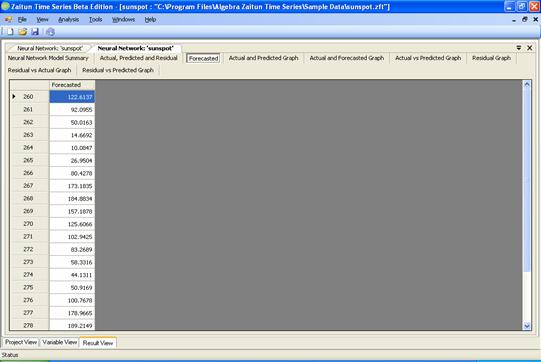
Shows actual, predicted and residual values of neural network model - Forecasted
Shows forecasted values from the neural network model, as many steps of data you want to forecast
- Model Summary
- Graphics
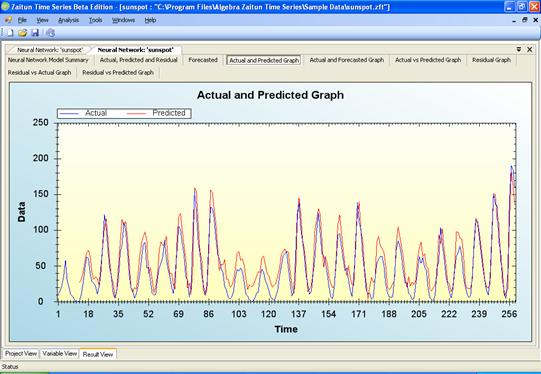
- Actual and Predicted
Shows a line plot for actual and predicted values of neural network model - Actual and Forecasted
Shows a line plot for actual and forecasted values of neural network model - Actual vs. Predicted
Shows a scatter plot between actual and predicted values - Residual
Shows a line plot for residual values of neural network model - Residual vs. Actual
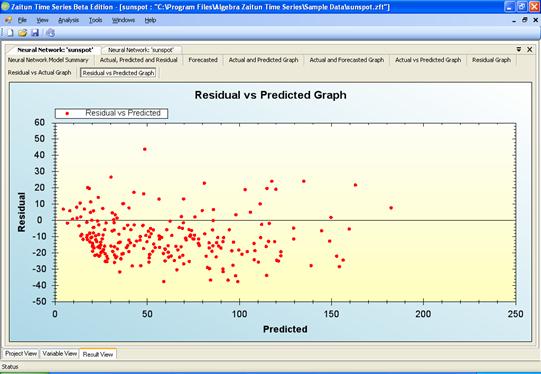
Shows a scatter plot between residual and actual values - Residual vs. Predicted
Shows a scatter plot between residual and predicted values
- Actual and Predicted
- Login to post comments